Radioactive Decay Coin Experiment
| ✅ Paper Type: Free Essay | ✅ Subject: Physics |
| ✅ Wordcount: 1578 words | ✅ Published: 30 Jan 2018 |
Understanding radioactive decay by experimenting with coins.
Abstract
The aim of this report is to show how to simulate the radioactive decay process using coins as a safer method of learning, the report is divided into six parts:
- Introduction: radioactivity, radioactive decay, half-life and the main purpose of the experiments are explained here. Hypothesis of both labs are detailed here.
- Method: the method to carryout both experiments is in detail in this section, provided in a step by step style that a reader can replicate the experiment himself.
- Results and discussion: The results of Lab 1 and Lab 2 are thoroughly discussed and analyzed in this section, and my hypothesis is held against the final results of the experiment.
- Conclusion: the final thought on the results from the experiments and if they did prove the hypothesis or not.
- References: a full list of all the references that contributed to this report are provided.
- Appendix: all the final data from Lab 1 and Lab 2 are provided for reference.
Introduction
Radioactivity can be described as the particles which are emitted from a nuclei as a result of nuclear instability. Radioactive decay is when the isotopes are unstable they tend to discharge energy in the form of radiation. There are a total of three main types of radiation or radioactive decay this depends on the type of the isotope:
- Alpha decay – When there are numerous protons in a nucleus the element will start to discharge radiation in the form of positive charged particles these are called alpha particles.
- Beta decay – When there are numerous neutrons in a nucleus the element will discharge radiation in the form of negative charged particles, these are called beta particles.
- Gamma decay – When there is an excessive amount of energy in the nucleus the gamma particles with no overall charge are discharged from the element.
The half-life of an isotope can be explained as the average time that takes half of the total number of atoms in a sample to decay eventually.
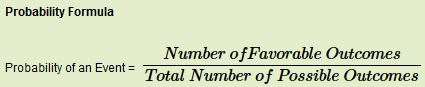
What this experiment aims to show is how probability is related to radioactive decay.
We use coins in this experiment as a model that reflects the randomness of the radioactive decay process. Keeping in mind the randomness of the results from this experiment, one should expect to achieve the desired results eventually (it is a matter of time and trial and error).
This experiment is divided into two parts: Lab1 where we deal with a greater number (195 coins in this case) and Lab2 where it’s a much lesser number (16 coins).
Hypothesis of the experiments: Since Lab 1 uses a large number of coins (195) there is a probability of 50% that the coins will flip if all of them were to be shaken at once, and this can be a very good representative of how half the atoms in an isotope will decay (half-life). I think that the same can be said about Lab 2 as I expect 50% of the 16 coins to decay as probability is the same regardless of the number of coins.

Method
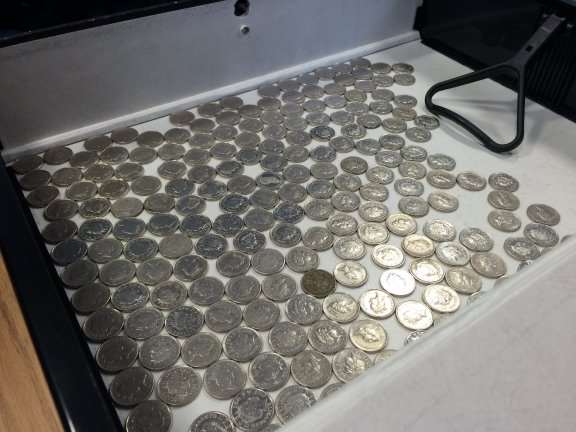
Lab 1: we put 195 five pence coins in a big black box shaped folder (all of the coins with their heads side facing up) and shook the box 20 intense shakes each attempt and then we proceed to open the box and count how many coins flipped to their tails side (this represent decaying) and the result gets recorded (number decayed each attempt, accumulated no. decayed and coins left) at the end of each trial the decayed coins are removed from the box. We keep doing this experiment until all coins are flipped to their tails side (decayed).
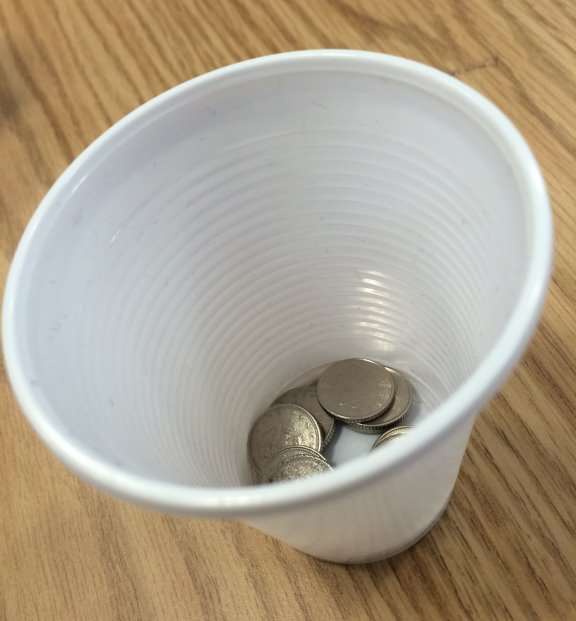
Lab 2: This time we are using less number of coins (16 five pence coins) and we put them in a plastic cup, for each attempt we shake the cup then we flipped the cup upside down on a table, then we check how many coins flipped to their tails side (decayed) for this first throw and we record them, then we put back the heads facing coins back to the cup and we repeat the process of shaking the cup and flipping it on the table until we have 2 heads facing coins or less, and we record how many attempts it took us to have 2 heads coins or less. All of this count as one trial, we do this process for up to 50 trials. Each trial gets recorded separately (Number of coins decayed first throw and number of throws to get 2 or less).
An alternative way to do the experiment if it is difficult to do physically is using this online coin toss simulator: http://nrich.maths.org/7220
Results and discussion
The results for lab 1 were similar to what I had in theory, approximately 50% of the coins decayed in the first trial and second trial, then the percentage became lesser and more random as the trials goes by.
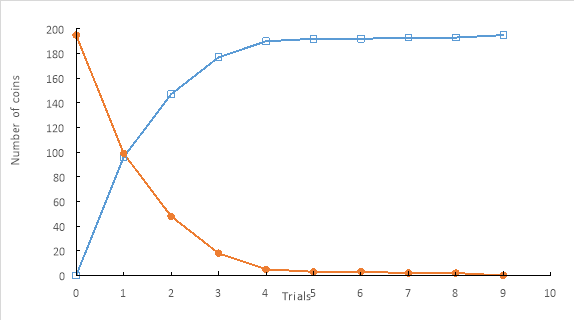
Figure 1: number of coins left (shown as circle markers) and the accumulated number of decayed coins (shown as square markers) against the number of trials.
It can be observed in figure 1 that the more coins we have (starting at 195) the higher the decay rate (that can be observed), but the lesser number of coins left the less obvious probability of the coins decaying even though the probability is the same (as the randomness of the decaying process is not related to a certain number of coins) as to make the decaying more obvious in smaller number of coins we did Lab 2:
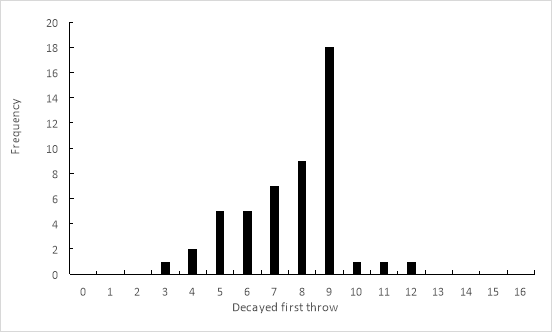
Figure 2: Frequency of the decayed coins in the first throw.
As shown in figure 2 the frequency of the 16 coins decaying in the first throw in each trial of the 50 trials is 9 which is still approximately 50% of the total number of coins, this proves my point that the probability of the coins flipping to their tails side (decaying) is the same regardless of the number of the coins in each experiment. Furthermore, the total number of coins decayed out of 16 coins in all of the 50 trials has been calculated and the total percentage was 47.75% again this is approximately 50% of the total number of coins in all of the 50 trials.
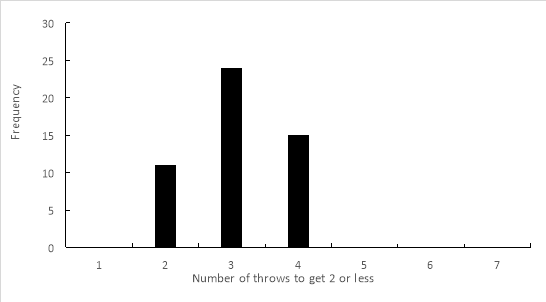
Figure 3: Frequency of the number of throw to get 2 or less
In figure 3 which show the frequency of how many throw of coins we need to reach 2 non-decaying coins or less in each trial (we stop at 2 rather than zero because it will take unnecessary large number of throws per trial), it further proves my hypothesis of the probability of 50% coins decaying as the most frequent number of throws to reach 2 or less was 3, we explain this by saying because 9 coins will mostly flip in the first throw (approximately 50% of the 16 total coins) it will take mostly 3 throws to reach 2 coins in the end because 50% of the coins will probably decay in each throw:
16 Coins > 50% Decay rate (In the first throw) > 8 Coins > 50% Decay rate > 4 Coins > 50% Decay rate > 2 Coins or less = 4 total number of throws going at a decay rate of approximately 50%, 3 throws to reach 2 or less is the most frequent number (also to back up this claim a calculation has been made by calculating the most frequent number of throw to get 2 or less over the total number of 50 trials and the average was 3.08 as provided in the appendix).
The decaying process is random in its nature so even if it is likely for the coins to have a 50% decay rate in the experiment done, it cannot be taken for granted.
Despite the fact that this final results for this experiment were satisfactory there was still some room for human error in this case, this can vary between simply not counting the coins correctly, to actually losing some of the coins. The experiment could easily be improved by doing the two labs two times between two students and they can compare the results afterwards. Another improvement can be done to the equipment that was being used as the box folder used in lab 1 had some holes in it that was not perfect for shaking the coins inside. Otherwise the coins themselves were all of the same kind (five pence) all of them having the same size and shape helped greatly in avoiding any confusion for the students doing the experiment. Obliviously since this is a student level experiment the equipment and method used were humble but satisfactory, but if this experiment were to be replicated by a higher level institution for a more serious cause then a machine should be used for tossing and counting the coins to get more accurate results.
Conclusion
The final results of the experiment were satisfactory and have proven my hypothesis and were helpful in understanding the randomness of the radioactive decay process, but as mentioned before, we can achieve better and more accurate results using more advanced methods.
References
- (Ducksters,2015)
http://www.ducksters.com/science/chemistry/radiation_and_radioactivity.php
- (Physics.org)
http://www.physics.org/article-questions.asp?id=71
- (Mini Physics)
http://www.miniphysics.com/radioactive-decay.html
- (Probability Formula,2011)
http://www.probabilityformula.org/
Appendix
Table 1: Lab 1 results
|
Trial Number |
Number Decayed |
Accumulated No. Decayed |
Number Left |
|
0 |
0 |
0 |
195 |
|
1 |
96 |
96 |
99 |
|
2 |
51 |
147 |
48 |
|
3 |
30 |
177 |
18 |
|
4 |
13 |
190 |
5 |
|
5 |
2 |
192 |
3 |
|
6 |
0 |
192 |
3 |
|
7 |
1 |
193 |
2 |
|
8 |
0 |
193 |
2 |
|
9 |
2 |
195 |
0 |
Table 2: Lab 2 results
|
Trial Number |
Number Decayed First Throw |
Number of Throws to get 2 or less |
|
1 |
9 |
2 |
|
2 |
6 |
3 |
|
3 |
11 |
3 |
|
4 |
9 |
4 |
|
5 |
4 |
4 |
|
6 |
3 |
4 |
|
7 |
5 |
4 |
|
8 |
9 |
3 |
|
9 |
6 |
4 |
|
10 |
9 |
2 |
|
11 |
9 |
3 |
|
12 |
8 |
3 |
|
13 |
6 |
3 |
|
14 |
9 |
3 |
|
15 |
7 |
3 |
|
16 |
12 |
2 |
|
17 |
10 |
2 |
|
18 |
9 |
4 |
|
19 |
7 |
3 |
|
20 |
9 |
2 |
|
21 |
5 |
3 |
|
22 |
8 |
3 |
|
23 |
8 |
3 |
|
24 |
7 |
3 |
|
25 |
8 |
3 |
|
26 |
9 |
2 |
|
27 |
5 |
4 |
|
28 |
7 |
3 |
|
29 |
9 |
4 |
|
30 |
8 |
3 |
|
31 |
9 |
3 |
|
32 |
9 |
4 |
|
33 |
9 |
2 |
|
34 |
7 |
4 |
|
35 |
9 |
2 |
|
36 |
7 |
4 |
|
37 |
8 |
2 |
|
38 |
6 |
3 |
|
39 |
5 |
4 |
|
40 |
8 |
3 |
|
41 |
9 |
3 |
|
42 |
5 |
4 |
|
43 |
9 |
3 |
|
44 |
8 |
3 |
|
45 |
4 |
4 |
|
46 |
6 |
4 |
|
47 |
8 |
2 |
|
48 |
9 |
3 |
|
49 |
9 |
3 |
|
50 |
7 |
2 |
|
47.75 |
3.08 |
|
|
Percentage of the total number of coins |
Average |
Table 3: A frequency table of the number of coins decaying in the first throw of each of the 50 trials.
|
Decayed First Throw |
Frequency |
|
0 |
0 |
|
1 |
0 |
|
2 |
0 |
|
3 |
1 |
|
4 |
2 |
|
5 |
5 |
|
6 |
5 |
|
7 |
7 |
|
8 |
9 |
|
9 |
18 |
|
10 |
1 |
|
11 |
1 |
|
12 |
1 |
|
13 |
0 |
|
14 |
0 |
|
15 |
0 |
|
16 |
0 |
|
50 |
Table 4: A frequency table of the number of throws to get 2 non-decayed coins or less throughout the 50 trials.
|
Throws to get 2 or less |
Frequency |
|
1 |
0 |
|
2 |
11 |
|
3 |
24 |
|
4 |
15 |
|
5 |
0 |
|
6 |
0 |
|
50 |
Cite This Work
To export a reference to this article please select a referencing stye below:
Related Services
View all


DMCA / Removal Request
If you are the original writer of this essay and no longer wish to have your work published on UKEssays.com then please click the following link to email our support team:
Request essay removal