An Experiment Determining Lift from Pressure Distributions
| ✅ Paper Type: Free Essay | ✅ Subject: Physics |
| ✅ Wordcount: 3359 words | ✅ Published: 18 May 2020 |
Abstract
The experiment described in this report used a pressure distribution over a NACA 0012 airfoil to determine the lift and moment coefficient about the quarter-chord on that airfoil. Lift is one of the most important and governing forces acting on a body moving in a fluid. The calculation of lift and drag is at the forefront of aerodynamics as a whole. Furthermore, understanding an airfoil’s pitching moment is of the utmost importance with regards to an aircraft’s stability. The lift and moment were calculated from the integration of the measured pressure distribution over both the upper and lower surfaces. While calculating lift and moment, the pressure distribution characteristics were shown for different angles of attack. The tests were conducted in the 2 foot by 2 foot wind tunnel, capable of Reynolds number ranging from 32,000 to 950,000.
Introduction
All aerodynamic forces and moments are generated by two main sources: pressure distribution and shear stress distribution. The experiment described in this report gives a way to determine the lift, drag and the moments (at least part of them) on a body from the pressure distribution. The pressure and shear are natures only two ways of communicating a force acting on a body [1]. The experiment does not deal with shear stress, so some of the drag, called skin friction drag should not accounted for. If all of the pressure and shear forces are summed up over the whole body, the resulting force and moment will be the total aerodynamic force and moment [1].
The lift generated by an aircraft’s wings is what allows the aircraft to overcome the effects of gravity. This makes determining the lift of airfoils of utmost priority to fit aircraft parameters and restrictions. The drag of an aircraft is the force that acts in the opposite direction of the free stream velocity. The drag is also important because with less drag means there will be less thrust required to achieve flight. This is very important because generating thrust is expensive, so by reducing drag the overall efficiency of the aircraft can be improved.
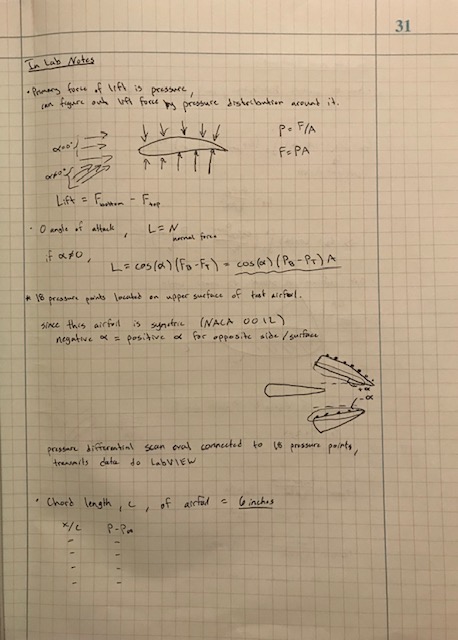
The experiment used a NACA 0012 airfoil shape, which is symmetric. It has 18 static pressure ports along the upper surface of the airfoil and these ports recorded the pressure at several different angles of attack and Re. The pressures are ran through a pressure transducers and values are stored so they can be later used to determine the lift and moment of the airfoil.
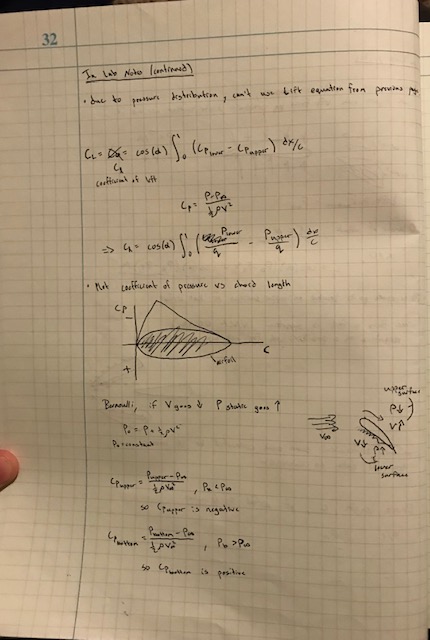
The lift force on a body moving through a fluid is the force acting perpendicular to the free stream velocity. The drag force on a body is the force acting parallel to the free stream velocity. These two forces are due entirely to the pressure and shear stress distributions over the body [3]. If a coefficient of these forces is introduced, the calculation of these forces can be simplified when changing certain parameters. The coefficient of lift is described by
[1]
The coefficient of lift can also be described by
[2]
where
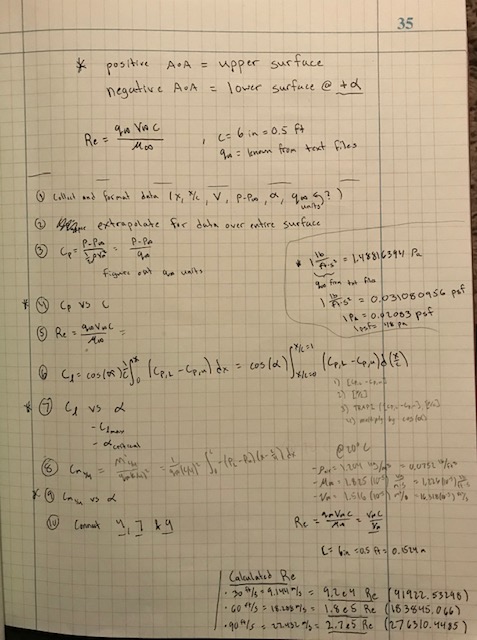
is a function. The moment about the quarter chord is derived by
[3]
and
[4]
However, regarding a symmetric airfoil,
= cl/2, meaning
[5]
Therefore, theoretically the moment coefficient about the quarter-chord should be equal to zero
[6]
These equations create a relationship between the pressure distributions, velocity, density, lift and moment. The coefficients are merely a convenient way of holding certain things constant during the calculation of the lift and drag so the calculation does not have to be repeated. The coefficient of pressure, as is present in
the earlier formulas, can be given by
[7]
The pressure coefficient is useful because once the coefficient of pressure has been determined, the pressure can be calculated for any other parameters since
is independent of them [2].
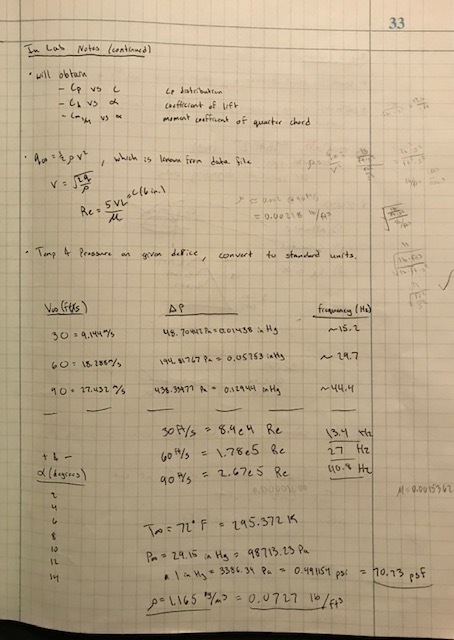
The Reynolds number is the ratio of inertial forces to viscous forces in an airflow. If the Reynolds number and Mach number are the same for two flows, as well as the model being geometrically similar, the flows can be modeled as dynamically similar [2,3] Wind tunnel testing hinges on this concept because it allows for the testing of small-scale models and controlled experiments to produce the exact same outputs as the real world flight would. The Reynolds number is given by

[8]
The higher the Re, the more the inertial forces dominate the flow.
The pressure force is the force per unit area that the fluid molecules exert on the body from the transfer of momentum. The total pressure is comprised of the static pressure plus the dynamic pressure. The static pressure is the pressure from the random motion of the fluid particles and does not include any of the momentum from the flow velocity. The dynamic pressure is the pressure due entirely to the flow velocity
momentum [2,3]. Total pressure can then be described by the equation
[9]
where the dynamic pressure is the second term on the right hand side of the equation.
A NACA 0012 airfoil is symmetric. This means that the flow over the upper and lower surfaces are the exact same at a 0-degree angle of attack, and the flows of any magnitude angle of attack are mirrored over the chord line. In other words, if at some
the flow over the upper and lower surfaces have certain characteristics, then at
the flow will be a mirrored over the chord line. The pressure data can then be collected on one side at a positive and negative alpha in order the get the distribution over the upper and lower surfaces for each magnitude of
while only having pressure ports on one side.
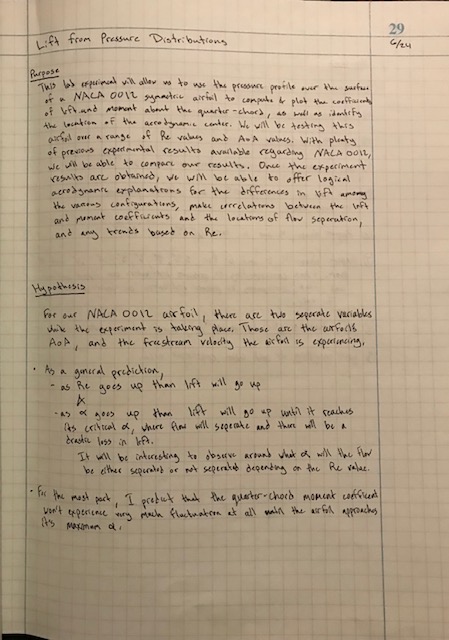
As a general predication, it is hypothesized that as the Re goes up than lift will increase as well. Also, increasing the angle of attack will similarly induce an increase in lift. That is until the airfoil reaches a critical angle of attack, causing flow separation and an immediate loss of lift. Careful examination of the different Re and angle of attack combinations and which cause flow separation will be of utmost importance during this experiment. Regarding the moment about the quarter-chord, it is hypothesized that not much fluctuation in the moment coefficient will occur. Possibly some jumps may occur while the airfoil is tested under its most extreme angle of attack.
Description of Test Equipment and Procedure
The experiment setup is shown in Figures 1 and 2. A 2 ft. by 2 ft. open circuit wind tunnel was used to test the airfoil.
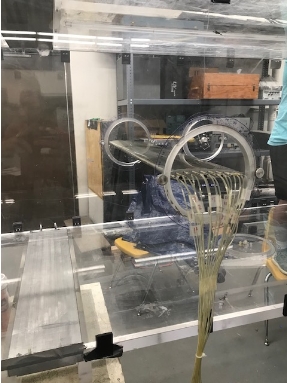
Figure 1: NACA 0012 Airfoil placed inside wind tunnel.
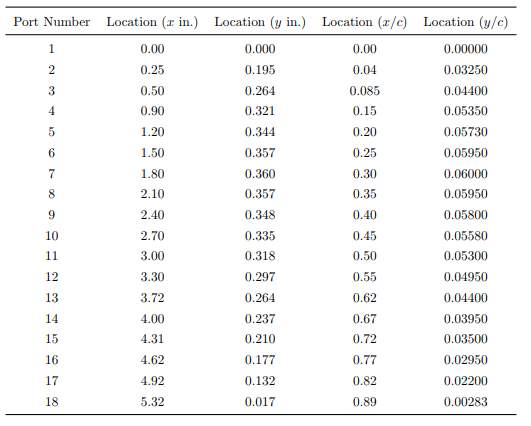
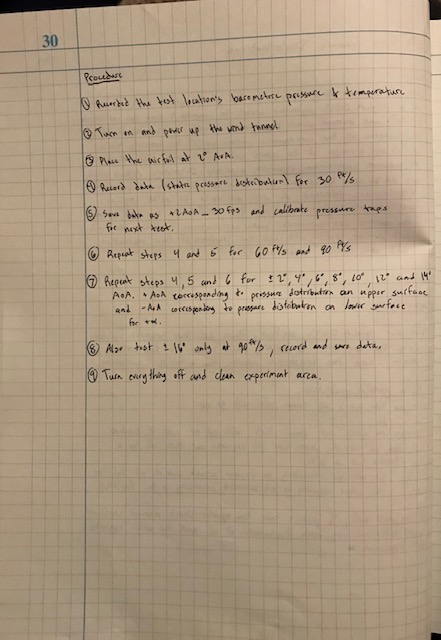
A monometer inside the tunnel was used to test the dynamic pressure inside the tunnel. A NACA 0012 airfoil, with chord 6 inches and a 2 ft. span that spanned the entire width of the test section. Since the airfoil spanned the whole width of the test section, the flow could be modeled as a 2D flow. 18 pressure ports on the upper surface of the airfoil were used to measure the pressure distribution for angles of attack at 2, 4, 6, 8, 10, 12, and 14 degrees, each at 30, 60, and 90 feet per second. Additionally, a 16 degrees angle of attack was also measured only at 90 feet per second. Then the process was repeated for the negatives of these angles so as to have the flow from the lower surface in part one to be on the upper surface where the pressure ports were in part two. The location of the pressure ports is shown in Table 1.
Table 1: Pressure port locations measured from leading edge [5]
The ports were connected to a scanivalve system which has a built-in pressure transducer and utilizes a PC with a data acquisition card to record the pressure data shown in Figure 2.
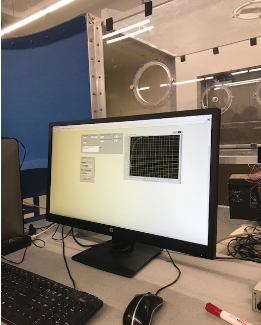
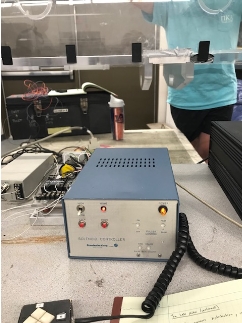
(a) (b)
Figure 2: (a) PC recording pressure distribution data with (b) scanivalve system and control system.
Results
The atmospheric pressure in the experiment was 14.3172 psi, and the temperature was 72
. These were used to calculate the density and pressures inside the testing section and determine the velocity.
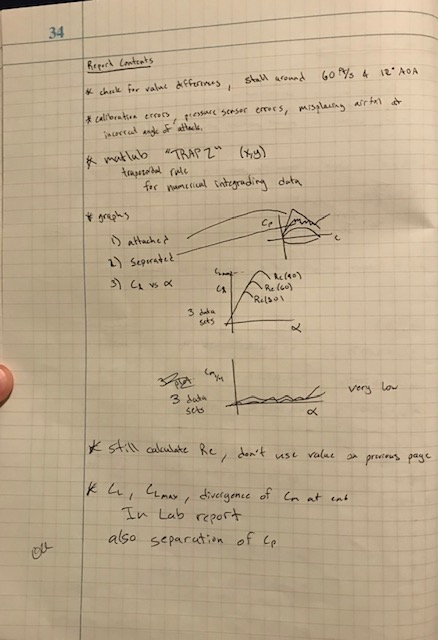
Upon completion of the in-lab portion of the experiment, all data was collected and compiled. Results of the Pressure Coefficient vs. Chord Length for 30, 60, and 90 feet per second are shown in Figures 3,4 and 5, respectively. Results for the Lift Coefficient vs. Angle of Attack are shown in Figure 6. And the results of the Moment Coefficient about the Quarter-Chord vs. Angle of Attack are shown in Figure 7.
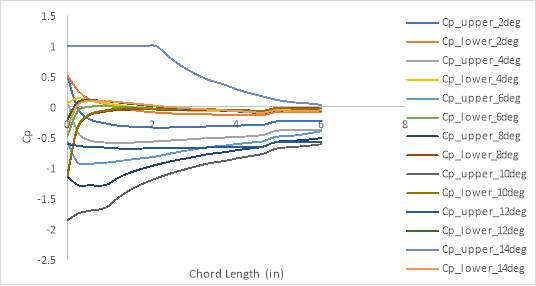
Figure 3: Pressure Coefficient vs Chord Length at 30 ft/s
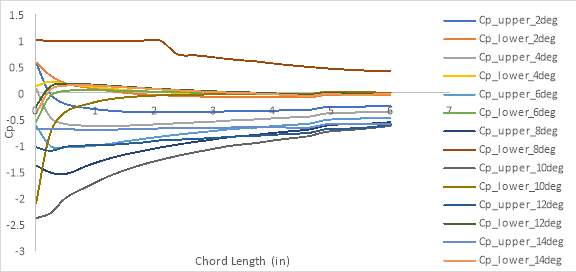
Figure 4: Pressure Coefficient vs Chord Length at 60 ft/s
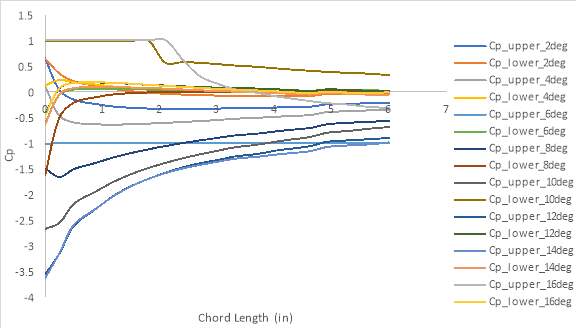
Figure 5: Pressure Coefficient vs Chord Length at 90 ft/s
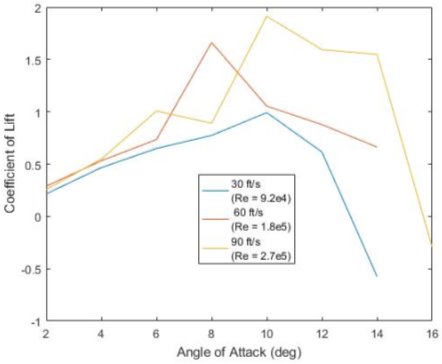
Figure 6: Lift Coefficient vs Angle of Attack
From studying Figure 6, the experimental data suggests the following. During the low Re value test, the airfoil produced a maximum lift coefficient of 0.9919 and a critical angle of attack of 10 degrees. The mid Re value test produced a maximum lift coefficient of 1.6617 and a critical angle of attack of 8 degrees. The high value Re test produced a maximum lift coefficient of 1.9127 and a critical angle of attack of 10 degrees.
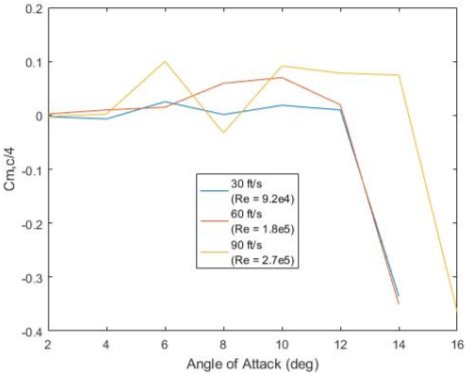
Figure 7: Moment Coefficient about the Quarter-Chord vs. Angle of Attack
As theoretically predicted, the moment coefficient about the quarter-chord remains approximately zero. This pattern holds until the airfoils maximum angle of attack. Stalling and flow separation around the airfoil enables the moment coefficient to drastically drop.
Discussion
After examination and interpretation of the experiment results, it seems that the collected data coincides with the initial predictions. The purpose of this experiment was to determine the pressure coefficient distribution, lift coefficient and moment coefficient about the quarter-chord of a NACA 0012 airfoil. Each of these properties was found by analyzing the pressure distribution on the upper and lower surfaces of the airfoil. The pressure distribution was found by taking pressure readings from eighteen pressure taps placed along the surface of the airfoil. Several different trials of this experiment were conducted each at a different Reynolds number. It was found that at low Reynolds numbers, the lift coefficient was not largely affected by a change in Reynolds number. However, the published results for the larger Reynolds number did exhibit different lift coefficients. It was also found that, discounting stall, all of the calculated properties performed very closely to that of thin-airfoil theory. Stall must be discounted because thin-airfoil theory does not account for stall.
As shown in Figures 3,4 and 5, both the lower and upper pressure coefficients are very different at the leading edge of the airfoil. The pressure on the upper face of the airfoil initially experiences a large decrease due to an increase in fluid velocity around the airfoil. Vice versa, the lower face of the airfoil is subject to an increase of pressure due to the fluid flow slowing down. Then the pressures slowly converge until nearing zero at the trailing edge of the airfoil.
As shown in figure 6, Reynolds number does seem to impact the lift coefficients. The lower Reynolds number clearly had a lower maximum lift coefficient while the higher Reynolds number had a greater maximum lift coefficient. Each experimentally determined response demonstrates the same general shape in that the lift coefficient generally increases linearly with angle of attack until it approaches the stall angle where it levels off and then begins to decrease. The experimental lift coefficient was determined to be in line with thin-airfoil theory. Thin-airfoil theory states that the lift coefficient increases by 2π units per radian [1]. Thin-airfoil theory, however, does not account for stall. This is illustrated in Figure 6 by the fact that the theoretical lift coefficient increases linearly and never levels off. The theoretical lift coefficient does behave similarly to the experimentally determined data very closely for the linear part of the response. This means that, disregarding stall, the NACA 0012 airfoil performed fairly like thin-airfoil theory predicted. Figure 6 shows the lift coefficient versus angle of attack results from several different trials of this experiment each at a different Reynolds number.
The center of pressure for a thin airfoil is defined as the position along an airfoil where the moment is equal to zero. As observed in Figure 7, all three responses exhibit similar shapes. Each center of pressure is relatively at around a value of 1.5 inches. Then the moment coefficients for each trial drastically fall and all converge at about -0.35. Overall, there is a very small change in the center of pressure throughout the experiment. This is compared to the theoretical center of pressure for thin-airfoil theory which is one-fourth of the chord length, or 0.25 in non-dimensional terms [1]. In general, the experimentally determined center of pressure is relatively close to the theoretical value if stall is discounted, which is acceptable since thin-airfoil theory does not account for stall. Also, from thin-airfoil theory it is stated that the aerodynamic center and the center of pressure are located at the same point [4].
Even though the results of this experiment lined up relatively closely with theory, there are still some unexplained anomalies that may be due to experimental error. Most importantly, the calculation of the free-stream velocity, and consequently Reynold number, may not have been accurate. The free-stream velocity was determined using the dynamic pressure reading that was assumed to be in the free-stream. It is possible that there was some kind of turbulence that effected this reading because of the nature of man-made wind. Another source of error was the angle of attack setting. The divisions on the dial were very small and difficult to see. Another source of error could be in the readings themselves. The pressure readings were read off a pressure transducer and input by hand into Excel. It is entirely possible that some of these readings could have been entered incorrectly or mislabeled. However, any major errors would have been apparent in the resulting plots, as seen in the lift coefficient vs angle of attack figure. A final source of error could be in the pressure transducer. There is concern that the pressure transducer was either calibrated incorrectly or not calibrated at all in-between tests. Also, it was fed pressure by small tubes connected to each tap on the airfoil; it is possible that there were leaks in these tubes which could have affected the pressure readings.
Conclusion
In conclusion, this experiment performed as expected. Discounting stall, the experimental results proved to be very similar to those of thin-airfoil theory. It was also found that at low Reynolds numbers, the lift coefficient was not drastically affected by a change in Reynolds number. The moment coefficient was found to remain around zero until reaching the maximum angle.
Lift is one of the most important and governing forces acting on a body moving in a fluid. Being able to fully study and understand this phenomenon can greatly increase performance, economic and environmental aspects for the aircrafts of the future.
References
[1] Anderson, J. D. Jr., “Fundamentals of Aerodynamics”, 5th ed., McGraw Hill, New York, 2011, pp. 19-22,233-234,320-360.
[2] Barlow, J. B., Rae, W. H., and Pope, A., “Low-Speed Wind Tunnel Testing”, 3rd ed., John Wiley & Sons, New York, New York, 1999, pp. 6-8, 102-109, 471-482.
[3] Anderson, J. D., “Fundamentals of Aerodynamics”, 4th ed., McGraw Hill, New York, 2007, pp. 19-30, 210-213.
[4] Anderson, J. D., “Introduction to Flight”, 8th ed., McGraw Hill, New York, New York, 2015, pp. 322-324
[5] Ahmed, A., Van Horn, E., Khan, O. and Shah, S. H. R., “Aerodynamics Laboratory”, Auburn University, 2019.
Appendix
Cite This Work
To export a reference to this article please select a referencing stye below:
Related Services
View all


DMCA / Removal Request
If you are the original writer of this essay and no longer wish to have your work published on UKEssays.com then please click the following link to email our support team:
Request essay removal