Data Analysis of Air Pollution in India and Its Effects on Health
| ✅ Paper Type: Free Essay | ✅ Subject: Environmental Sciences |
| ✅ Wordcount: 2417 words | ✅ Published: 23 Sep 2019 |
Data Analysis of Air Pollution in India and its effects on health
Abstract: Air contamination happens when unreasonable amounts of substances including gases, particulates, and organic atoms enter Earth’s environment. It might cause maladies, hypersensitivities and even demise to people. Air Pollution is worst in India and is likely to cause more deaths.
Amongst the top five causes of deaths worldwide is CVD, COPD, lower respiratory infections, and lung cancer. This paper is to bring into highlight the air pollutants in India and its effects on health. As Delhi is the capital of India, so the focus of research was more on Delhi along with Haryana from 2012- 2018 as compared to other states.
Keywords: Air Pollution, Respiratory disease, Cardiovascular disease, Immune system, asthma, Delhi, Punjab, Haryana, Uttar Pradesh, India, Data Analysis.
Introduction –
There were 7 million deaths in 2012 (WHO, 2015) because of air contamination. Nine out of 10 individuals on the planet inhale contaminated air.
Recently, the air contamination status in Delhi has experienced numerous adjustments as far as the levels of toxins and the control estimates taken to diminish them. The database of the World Health Organization in September 2011 shows that Delhi has the most extreme PM10 value by very nearly 10-times at 198 μg/m3. Vehicles discharges were observed to be related to indoor and open-air contamination in Delhi. [1] Contaminated air has a negative effect on a human, influencing various distinctive frameworks and organs. It shows intense respiratory contaminations in young and constant bronchitis in grown-ups, lung infection, and asthma. Change in vaporous and particulate air toxin fixations have a checked and close transient relationship with unfavorable results [2].
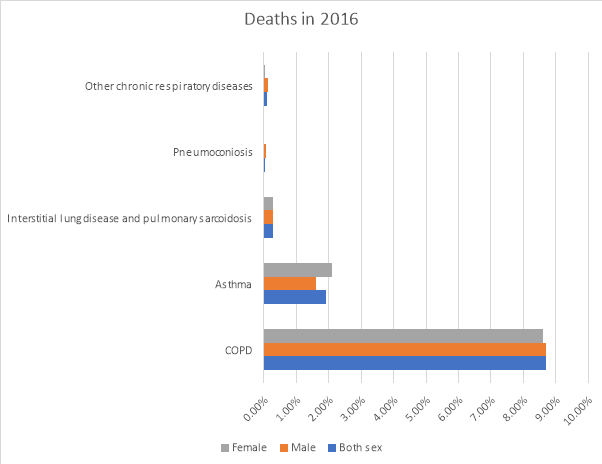
Fig1 Female death is more in 2016 as compared to Male from Asthma and COPD.
Air pollutants are classified as suspended particulate matter (dust, fumes, mists, and smokes); gaseous pollutants (gases and vapors); and odors. PM10 is smaller than 10 microns (10µm) and is most hazardous. PM2.5 occurs by the condensation of gaseous pollutants such as SO2, Sulfur trioxide, and Carbon monoxide; Nitrogen compounds such as nitric oxide, NO2, and ammonia; Organic compounds such as hydrocarbons; Volatile organic compounds; polycyclic aromatic hydrocarbons and halogen derivatives such as aldehydes; and odorous substances. [4] Air Pollution effects the immune system of the body, which acts as a host defence system that protects against the disease [3].

TSPM: Stands for Total Suspended Particulate Matter and one would get when a high-volume mass concentration is done on a channel substrate.
RSPM is a small portion of TSPM which is breathed in by people through their respiratory framework. and when all is said in done, considered as a particulate issue with their breadth (streamlined) under 2.5 micrometres.
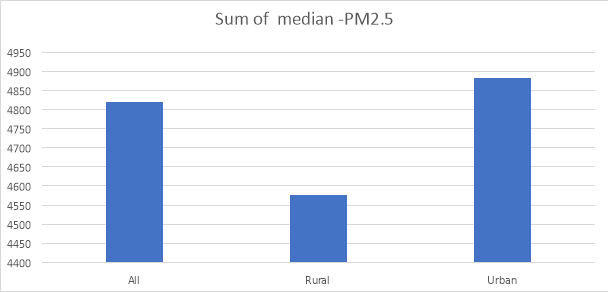
Fig2 PM2.5 Median taken shows the Urban area more polluted in 2016
Material and Methods
The data was searched thoroughly in Google search and PubMed. Data was obtained from World health Organization (WHO), Central Pollution Control Board (CPCB), PPCB (Punjab Pollution Control Board), and Data.gov.in.
Results-
India is at 7th position among 20 most contaminated countries of the world. Anand Vihar, R.K Puram, and Punjabi Bagh are found to be the most contaminated regions of Delhi, and Amritsar among Punjab found to have most contaminated air. Air Quality Index was found to be higher in these regions. Although AQI has improved in 2017 than that of 2016, still it is higher. Odd-Even campaign done in 2016, in April (15-30) NO2 increases in Anand Vihar. The average PM2.5 and PM10 were found to be higher during the odd-even periods when compared with the pre-trial days [15].
The RSPM value has increased from 2013- 2016. It shows decreased in 2017 in the month of October in data available from PPCB for Vinod Milk Chilling center, Amritsar but shows an increase from May-Oct and decrease from Jan-March and same in April.
Muzaffarnagar shows the high value of PM2.5 in Uttar Pradesh and Jhangirpuri and Anand Vihar shows high PM2.5 value on Diwali Day 2018 at 6:00 PM.
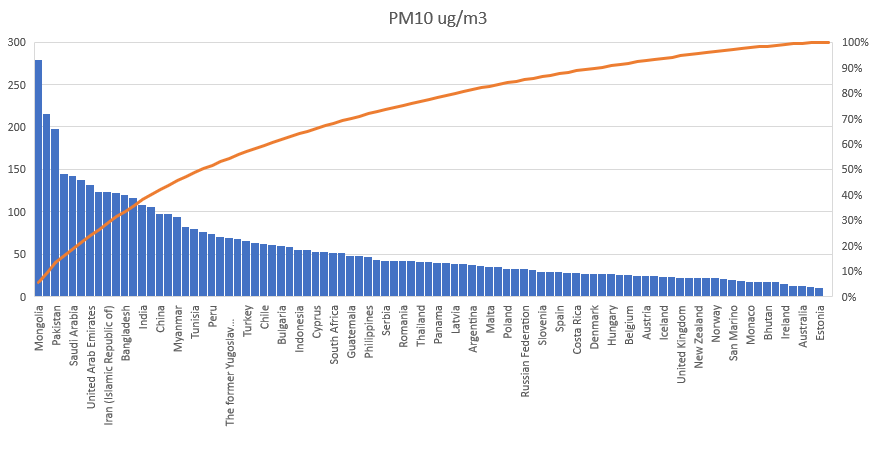
Fig3 India comes at 7th position in the world as highly populated country (WHO)
Air Pollution in Haryana on Diwali Day


451
391
FARIDABAD GURGAON
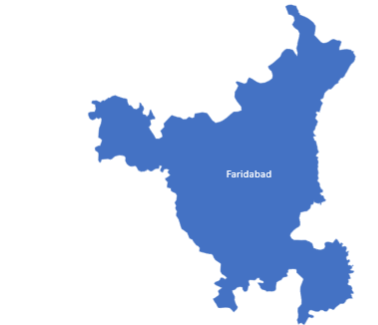
Haryana is more polluted specially Faridabad Town with high AQI Value in 2018 as compared to previous Diwali.
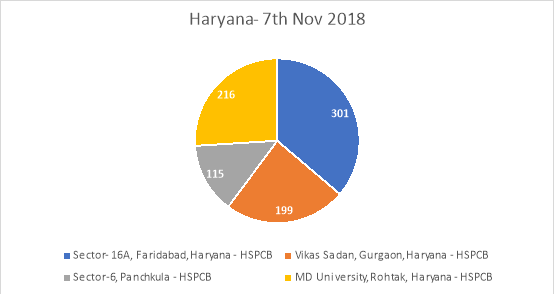
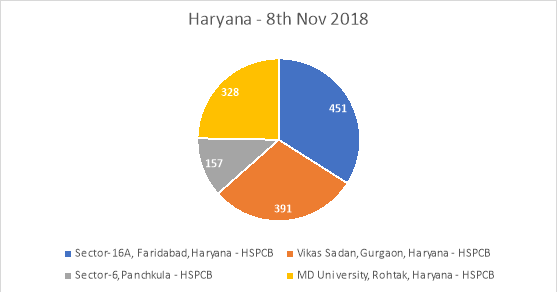
Fig 4 The most air pollution in Haryana is in Faridabad in Sector 16 A recorded on Diwali day.
Air pollution in Punjab
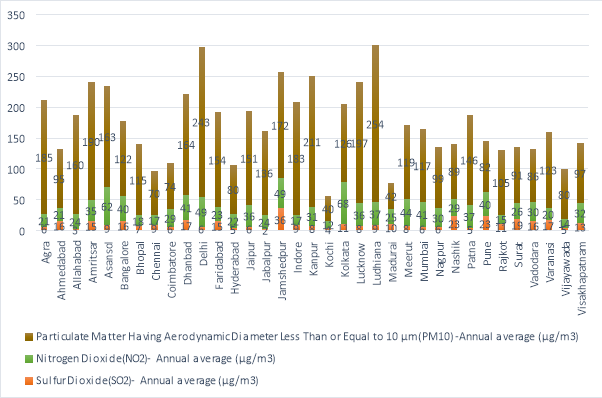
Fig 5 Air Quality in Metro Cities 2009 in which Delhi has PM 10 value 243 and that of Ludhiana is 254.

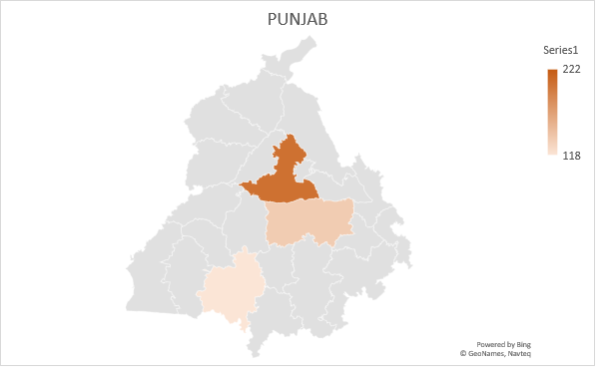
Diwali day Punjab Mandi Govindgarh at high value of PM2.5 222 and less of all is Bathinda with PM2.5 value of 118.
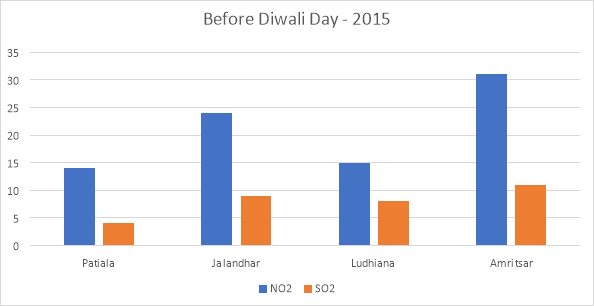
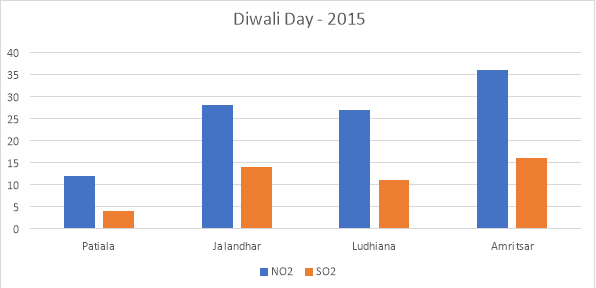
Fig 6 Air pollution in 2015 in Punjab
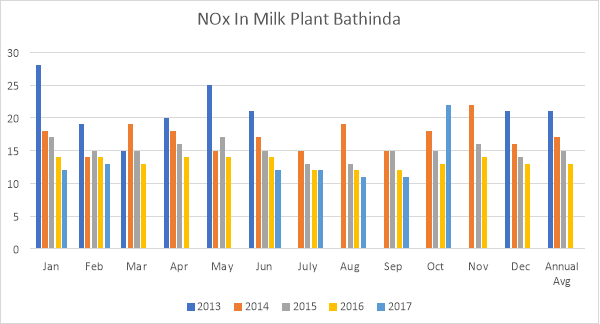
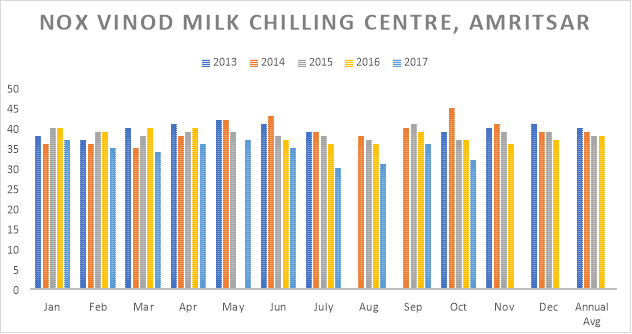
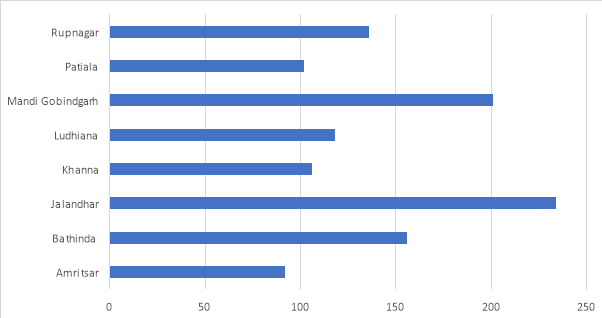
Fig 7 Air quality on 13th Nov 2018 in Punjab Mandi Govindgarh and Jalandhar the highly polluted areas
Air pollution in Karnataka
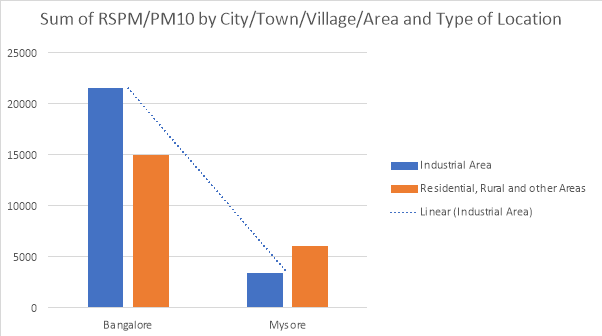
Fig 8 2015 shows Bangalore more polluted then Mysore
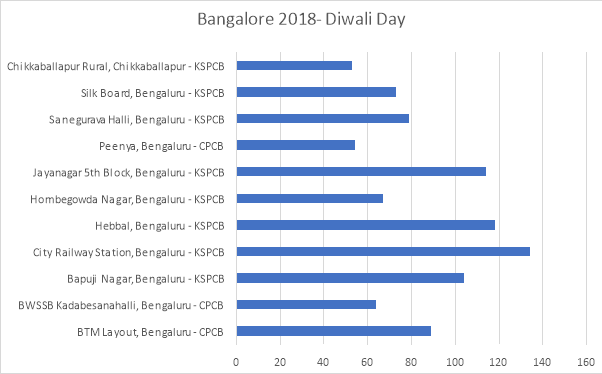
Fig 9 Diwali Day AQI Index of 134 was seen in City Railway Station, Bangalore.
The basic dimensions of PM are probably going to damagingly affect the soundness of the nationals in Bangalore that may result
in a gigantic weight on the general wellbeing framework. Likewise, if this somehow happened to influence the talented youthful human asset, it would represent a risk to the city’s economy that is developing exponentially. It is essential
that the administration tends to the issue of wellbeing affect because of air contamination by holding fast to stringent
proportions of contamination control.
There is a requirement for more extensive research and distributions in the zone of air contamination and its consequences for wellbeing. Specifically, the advancement of an important and far reaching proof base would prepare Bangalore and India with the capacity to take educated activities [14]
Air pollution in Delhi
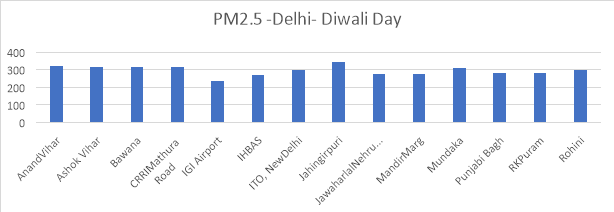
Fig 10 Jhangirpuri showing the high AQI value in Delhi
Diwali Day in Delhi
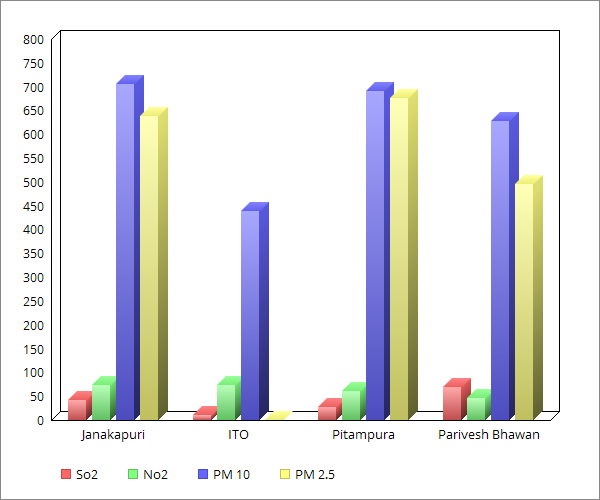
Fig 11 Air Pollution on Diwali day in various areas of Delhi in 2017
On Diwali Day PM10 value was high in Janakapuri as compared to ITO, Pitampura and Parivesh Bhawan. PM2.5 is higher in Pitampura. The So2 conc. And PM 10 and PM2.5 increases as compared to pre-Diwali day.
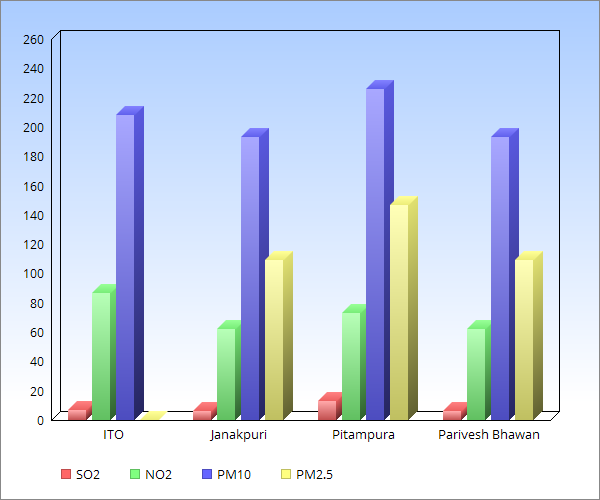
Fig 12 Air Pollution Pre-Diwali Day in various areas of Delhi in 2017.
On Pre-Diwali day the value of PM 10 was noticed higher in Pitampura.
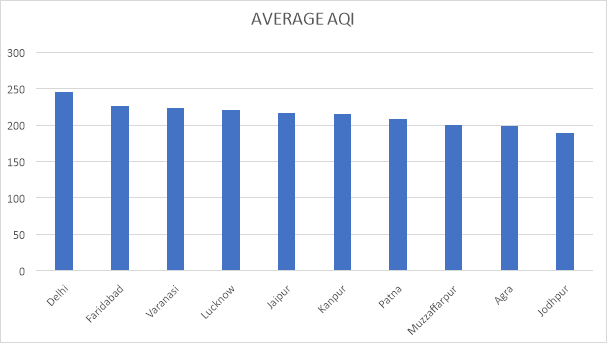
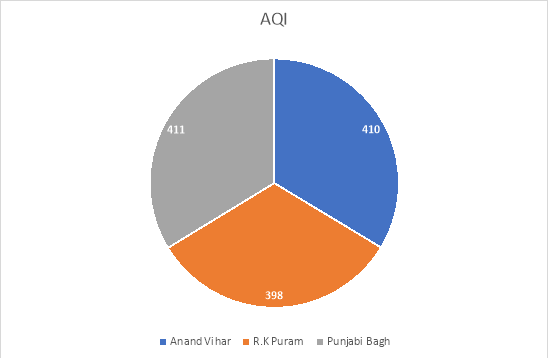
Fig 13 Air Quality Index 2017 in Anand Vihar , RK Puram and Punjabi Bagh
Air Quality Index in 2017 is higher in Delhi as compared to Faridabad, Varanasi, Lucknow, Jaipur, Kanpur, Patna, Muzzaffarpur, Agra and Jodhpur.
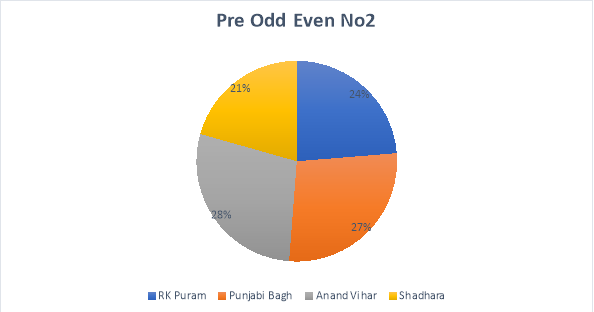
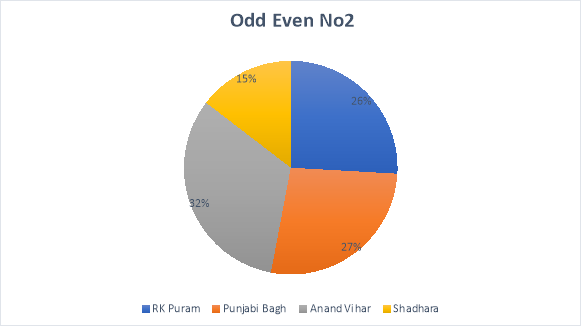
Fig 14 Odd Even (April 15-30) and Pre-Odd Even (April 1-14) No2 Conc in 2016. In R.K Puram, Punjabi Bagh, Anand Vihar and Shadhara
During Odd- even in Delhi NO2 conc. Was found to be higher in Anand Vihar.
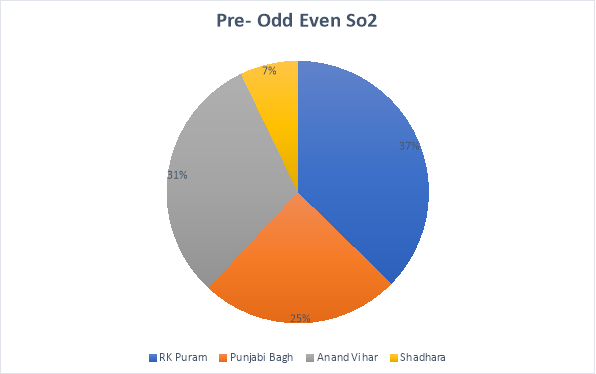
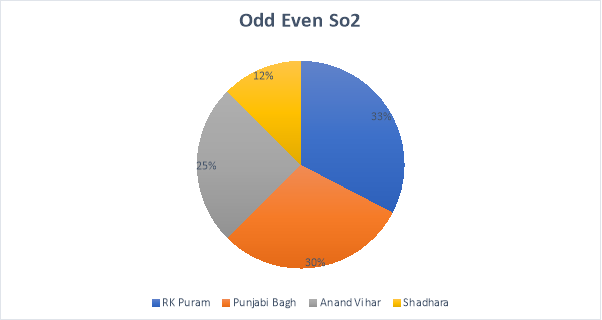
Fig 15 Odd Even and Pre-Odd Even So2 Conc. In R.K Puram, Punjabi Bagh, Anand Vihar and Shadhara
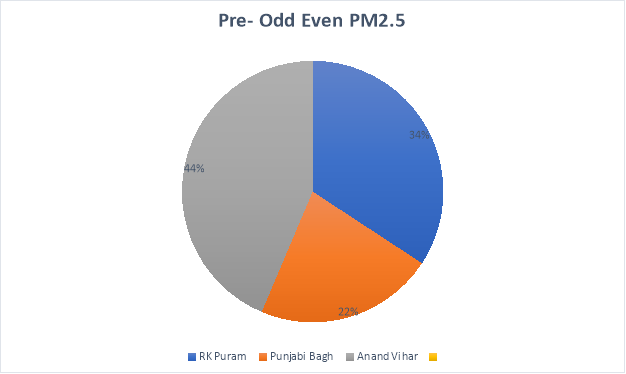
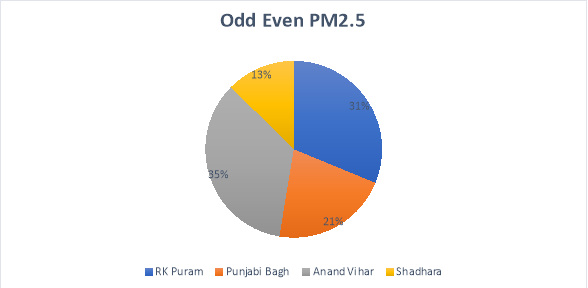
Fig 16 PM2.5 VALUE in RK Puram, Punjabi Bagh, Anand Vihar and Shadhara
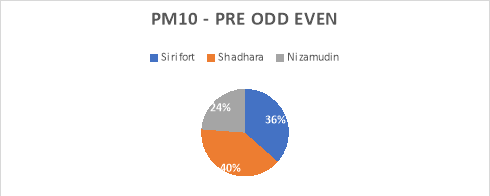
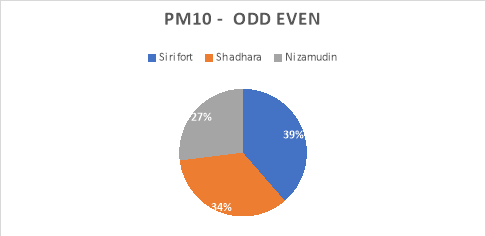
Fig 17 PM10 values
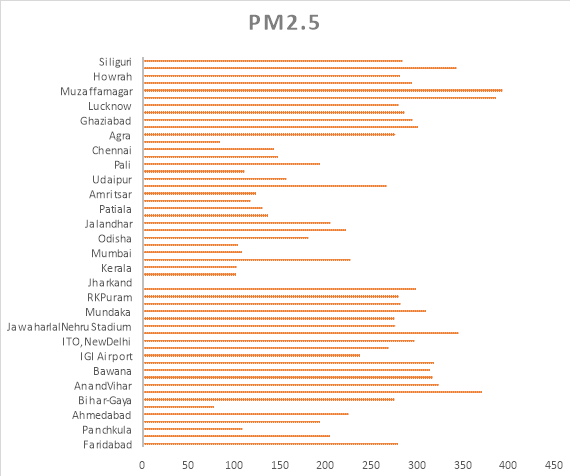
Fig 18 Showing PM2.5 value in various areas of India.
Types of Pollution-
1) Air Pollution – It is caused by harmful gases and smoke. Harmful gases include oxides of Carbon, Nitrogen and Sulphur. There are two types of air pollution.
a) Outdoor pollution
b) Indoor pollution
a) Outdoor Pollution- Sources for outdoor pollution includes both natural and manmade where natural pollution includes forest fires, oxides of sulphur and nitrogen lightning strikes and particulate matter. Manmade includes burning of fuels such as coal, oil, power stations, industries and vehicles.
b) Indoor pollution – Air inside the house or in office building is refer to as indoor air pollution and is more dangerous then Outdoor pollution as we spend most time in the house or in office. Source of indoor pollution includes tobacco smoke, pesticides be used, household products and mostly the materials used inside the house making such as formaldehyde and leads.
2) Noise pollution- Noise pollution
or Sound pollution have the harmful effect of noise on human and animals. Machine, transport, loud music is the major cause of sound pollution.
3) Water pollution—It is the contamination of water bodies like lake, rivers, ground water and oceans as a result of human activities. It ccurs when the waste water get mixed with natural water making it unsafe, polluted for drinking, and irrigation purpose.
4) Land or Soil Pollution: It is the pollution in which land is filled with industrial waste or garbage’s.
Effects of health on Air pollution
Respiratory diseases in Delhi from 2012 arose to 5 million. Chronic Obstructive Pulmonary disease has been increased from 2016 and is of great concerned as the ambient air quality is getting worse. There has been rise of COPD cases from 28.1 million cases to 55.3 million cases in 2016 and an increase in prevalence from 3.3 % to 4.2% [6]. It also has side effect on heart making an increase in Cardiovascular disease. [5] About 2000 patients for the age group of 18-70 yrs was tested suffering from COPD in Ludhiana district, and surrounding areas of Moga, Jalandhar, Machiwara, and Ferozpur. Air pollution in Punjab is highly concerned effecting young people with COPD. Outdoor air pollution has also become leading cause of cancer. Most of the effect of pollution is creation of hole in the ozone layers which protects us from harmful Ultraviolet rays emitted by the Sun, and it may cause skin cancer and cataract [ 7].
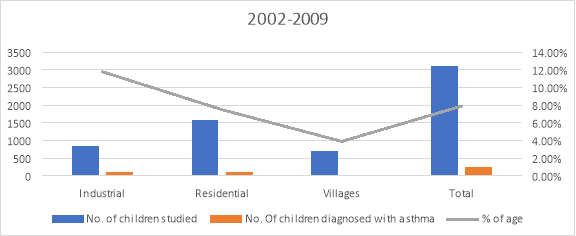
Fig 19 Asthma cases were studied among children’s in Delhi in 2002-2009.
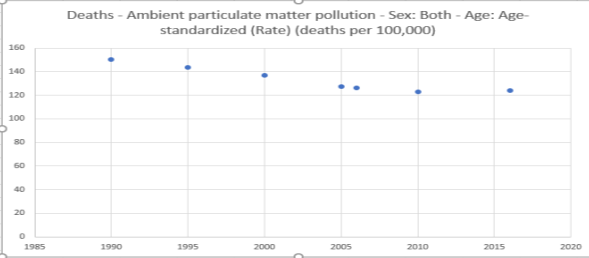
Fig 20 Death rate due to Air Pollution in India in 2016
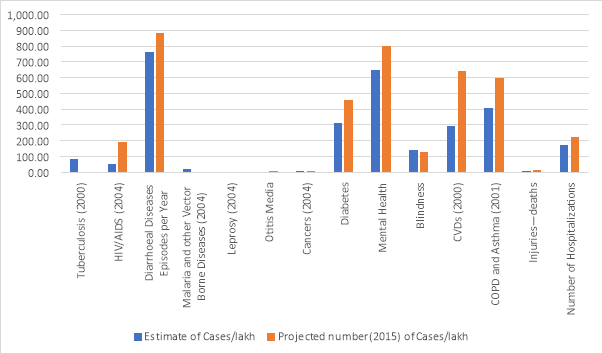
Fig 21 COPD death cases were more in 2016
Discussion
The conc. Of No2, So2, PM10 increases during Diwali day in a study done from 2002 -2007 [8] Similar results have noticed an increase in conc. Of SO2, PM 10, PM2.5 however, the conc. Of NO2 was found to be less on Diwali day as compared to Pre- Diwali day in various areas of Delhi. In research done in 2006-2008, it didn’t show considerable variation in conc. Of NO2 [9].
Comparison of data of 5th Nov 2017 and 5th Nov 2018 shows PM2.5 value high in Punjabi Bagh. Anand Vihar ranks high PM2.5 value for 05 Nov 2018 from Punjab, Faridabad, Uttar Pradesh, etc. Agra seems to be highly polluted at 9 AM then 05 Nov 2018 at 6:00 PM and there was an increase in PM2.5 value in Panchkula and Ahmedabad. Day time should have been decreasing as other cities except for Kanpur for which data was not available but Agra shows high PM2.5 value. This year before Diwali PM2.5 and NO2value have increased as compared to previous Diwali day in areas of Delhi Anand Vihar, R.K Puram, and Punjabi Bagh. These areas are quite unsafe for people to breath as they are more risk in developing heart or COPD and cancer disease.
PM 10 value for Anand Vihar is more than RK Puram and Punjabi Bagh in April, October and November data.
Anand Vihar, Jahangirpuri is found to be the more polluted area of Delhi. [10]. In Apr PM10 value is more cause of pollution whereas in Oct and Nov the main cause of pollution is PM2.5.
Most of the pollution is from the Residential area as compared to the industrial area in 2015. PM2.5 is higher as compared to PM10 value on Diwali Day.
Tobacco smoke and traffic pollution are mostly affecting the health of children [12]
There seems to be correlation between PM2.5, NO2, SO2, CO and PM10; however, the correlation between PM2.5 and NO2 was found to be 0.50 and that of PM2.5 and PM10 was found to be 0.68
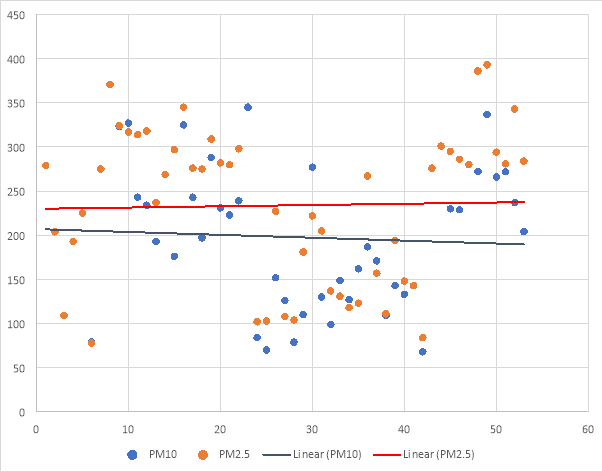
Fig 22 Showing correlation between PM2.5 and PM10
Correlation coefficient for PM2.5 NO2 is 0.468688 and for that of PM2.5 and PM10 IS 0.8
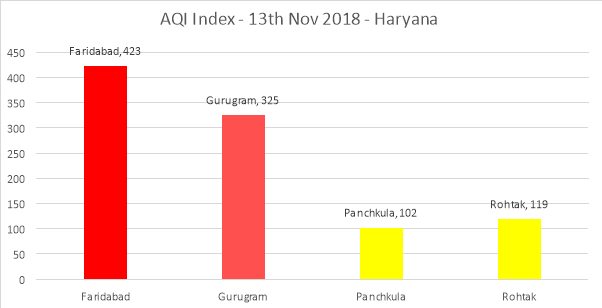
Fig 23 Faridabad the high polluted area
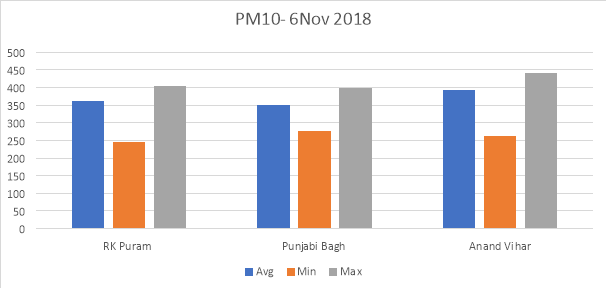
Fig 24 Anand Vihar showing high pollution as compared to RK Puram and Punjabi Bagh.
Conclusion
The research done shows that almost entire Delhi, mainly Ashok Vihar, Wazirpur, Jhangirpuri, Anand Vihar, RK Puram, and Punjabi Bagh, UP mainly Muzffarnagar, Greater Noida, Haryana mainly Faridabad are quite unsafe for people living. In Punjab Mandi Govindgarh and Jalandhar are most polluted areas. There was rise in respiratory cases in Anand Vihar and Anand Vihar is considered as the most polluted area of Delhi. The highest AQI index on Diwali day was found to be in UP and on next day in Faridabad. Air pollution is the biggest problem in India in the three states Delhi, UP and Haryana and it is cause of respiratory, cardiovascular disease and skin cancer.
Bibliography
- Rizwan S, Nongkynrih B, Gupta SK. “Air pollution in Delhi: Its Magnitude and Effects on Health”. Indian J Community Med. 2013;38: 4–8. doi:10.4103/0970-0218.106617
- Shah ASV, Langrish JP, Nair H, McAllister DA, Hunter AL, Donaldson K, et al. Global association of air pollution and heart failure: a systematic review and meta-analysis. Lancet. 2013;382: 1039–1048. doi:10.1016/S0140-6736(13)60898-3
- Diaz-Sanchez D. Pollution and the immune response: atopic diseases – are we too dirty or too clean? Immunology. 2000;101: 11–18. doi:10.1046/j.1365-2567.2000.00108.x
- Kjellstrom T, Lodh M, McMichael T, Ranmuthugala G, Shrestha R, Kingsland S. Air and water pollution: burden and strategies for control. In: Jamison DT, Breman JG, Measham AR, Alleyne G, Claeson M, Evans DB, et al., editors. Disease control priorities in developing countries. 2nd ed. Washington (DC): World Bank; 2006.
- Maji S, Ghosh S, Ahmed S. Association of air quality with respiratory and cardiovascular morbidity rate in Delhi, India. Int J Environ Health Res. 2018;28: 471–490. doi:10.1080/09603123.2018.1487045
- India State-Level Disease Burden Initiative CRD Collaborators. The burden of chronic respiratory diseases and their heterogeneity across the states of India: the Global Burden of Disease Study 1990-2016. Lancet Glob Health. 2018; doi:10.1016/S2214-109X(18)30409-1
- Jeran HOA, Khan AR. The Effect of Air Pollution on Ozone Layer Thickness in Troposphere over the State of Kuwait. Am J Environ Sci. 2009;5: 230–237. doi:10.3844/ajessp.2009.230.237
- Singh DP, Gadi R, Mandal TK, Dixit CK, Singh K, Saud T, et al. Study of temporal variation in ambient air quality during Diwali festival in India. Environ Monit Assess. 2010;169: 1–13. doi:10.1007/s10661-009-1145-9
- Mandal P, Prakash M, Bassin JK. Impact of Diwali celebrations on urban air and noise quality in Delhi City, India. Environ Monit Assess. 2012;184: 209–215. doi:10.1007/s10661-011-1960-7
- Delhi’s pollution nearly 30 times higher than WHO’s safety benchmark | Environment News [Internet]. [cited 10 Nov 2018]. Available: https://zeenews.india.com/news/eco-news/delhis-air-quality-hits-new-low-pollution-exceeds-permissible-limit_1819668.html
- National Air Quality Index [Internet]. [cited 10 Nov 2018].
- Singh S, Sharma BB, Sharma SK, Sabir M, Singh V, ISAAC collaborating investigators. Prevalence and severity of asthma among Indian school children aged between 6 and 14 years: associations with parental smoking and traffic pollution. Journal of Asthma. 2016;53: 238–244. doi:10.3109/02770903.2015.1087558
- Global Burden of Disease Collaborative Network.Global Burden of Disease Study 2016 (GBD 2016) Results.Seattle, United States: Institute for Health Metrics and Evaluation (IHME), 2017.Available from https://ghdx.healthdata.org/gbd-results-tool.
- Air Pollution in Bangalore, India: A Six-Year Trend and Health Implication Analysis Conference Paper · November 2014
- Kumar, P., Gulia, S., Harrison, R. M. and Khare, M. (2017). The influence of odd-even car trial on fine and coarse particles in Delhi. Environmental Pollution 22520–30.
Cite This Work
To export a reference to this article please select a referencing stye below:
Related Services
View all


DMCA / Removal Request
If you are the original writer of this essay and no longer wish to have your work published on UKEssays.com then please click the following link to email our support team:
Request essay removal