Opto-Electronics for Communications: Spectrum Analysis
| ✅ Paper Type: Free Essay | ✅ Subject: Engineering |
| ✅ Wordcount: 2583 words | ✅ Published: 31 Aug 2017 |
This experiment studies the wavelengths of the colours in the spectrum of a light source. I will measure the angle at which colour splits. I will carry out this experiment with three different light sources:
- Tungsten
- LED
- Laser Diode
Light Source Spectrum
The electromagnetic spectrum describes all the wavelengths. It ranges from the smallest waves possible, radio waves to the largest waves, Gamma radiation. All different size waveforms have different uses.
|
Energy |
Frequency |
Wavelength |
Radiation type |
Typical use |
|
Lowest |
Lowest |
Longest |
Radio waves |
Television signals |
|
|
|
|
Microwaves |
Cooking, mobile phones |
|
Infrared |
Optical fibre communication |
|||
|
Visible light |
Seeing |
|||
|
Ultraviolet |
Detecting forged bank notes |
|||
|
X-rays |
Medical images of bones |
|||
|
Highest |
Highest |
Shortest |
Gamma radiation |
Killing cancer cells |

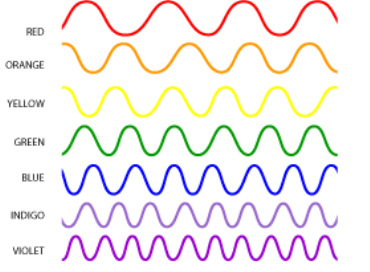
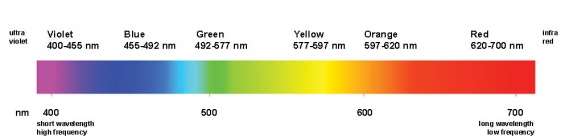 The only Electromagnetic waves we can see are Visible Light Waves. We see visible light waves as colours of the rainbow. Each different colour has its own wavelength different to the others. The longest wavelength is Red, with the shortest wavelength being Violet. The combination of all the light wave colours makes white light.
Diffraction
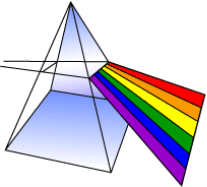
We can see each colour of the Visible light spectrum by shining a white light through a prism. By diffraction, the white light splits apart into different colours of visible light. Water vapour can carry out the same effect of diffraction, and the result is a rainbow.

Gratings
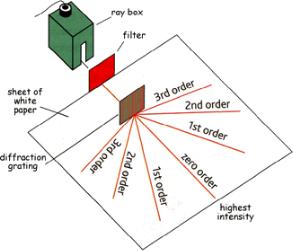
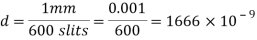
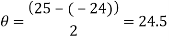
A diffraction grating is a slide with a number of parallel slits drawn on it. The slits are very small, usually 600 per 1mm. When a beam of light is directed at the grating, light will diffract of it and the light is dispersed in certain directions only. This is commonly used to separate colours of the incident light because the diffracted light has different angles according to:


All equipment used for this experiment was taken from the ‘PASCO Educational Spectrophotometer Accessory Kit’
- Rotary Motion Sensor
- Aperture Bracket
- Light Source
- PASCO data acquisition software
- High Sensitivity Light Sensor
Equipment Setup

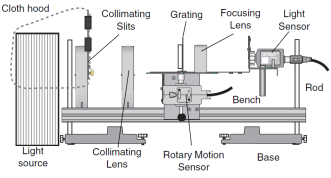
Set up the Spectrophotometer next to your chosen light source as shown in Figure 2.- Mask the light source with Collimating Slits so it transmits a thin 0.5 to 1.0 cm beam. A hood should be used over the light source to remove any distortion in the experiment results.
- Align the light source. Turn on the light source and align the light beam by adjusting the Collimating Slits, Collimating Lens and Focusing Lens so a clear image of the central ray appear on the light sensor.
- Connect the Light Sensor and Rotary Motion Sensor to channels A and B of the PASCO computer interface.
Software Setup
- Open the PASCO data acquisition software.
- Connect Digital channels 1 and 2 to the Rotary Motion Sensor. Connect Analog Channel A to the Light Sensor.
- Set up parameters for the Rotary Motion Sensor. A sample rate of 20 Hz with a high resolution of 1440 Divisions per Rotation.
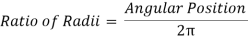
- Use the PASCO software’s calculator function to calculate the Actual Angular Position based on the Angular Position measurement made by the Rotary Motion Sensor. The measured Angular Position should be divided by 2Ï€.


Data Recording Setup
- In the PASCO data acquisition software, select the graph mode.
- Select the vertical axis as Light Intensity, and Horizontal axis as Actual Angular Position.
- Turn off the lights in the laboratory to ensure the results are as accurate as possible and no background light interferes.
- On the top of the light sensor select the appropriate gain setting. Different light sources will require different settings.
- Select “Start Recording Data”
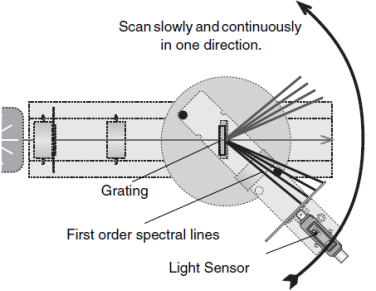
- Turn the light sensor slowly in one complete circle. This will scan through the first order spectrum lines and data will be recorded in the PASCO data acquisition software.

 Select “Stop Recording Data”
Data Analysis Setup
The size of the wavelength can be calculated by analysing the results of the experiments and using the gratings equation. By using a visible light spectrum, we can determine what colour the light is from the size of the calculated waveform.
— Wavelength

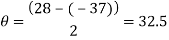
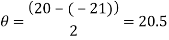
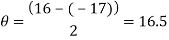
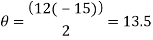
Measure the two peaks, R1and R2
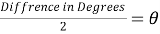


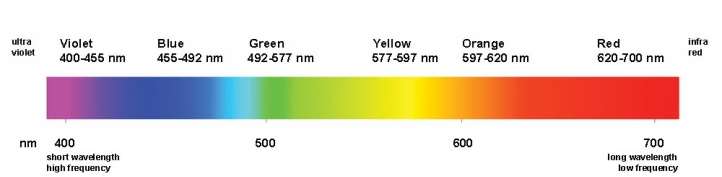 Use the visible light wavelength spectrum below to find out what the wavelegth is
Tungsten Light Source
Dating back to the 1800’s, Tungsten light sources are the oldest and most tested light source invented. They first became commercialised by Thomas Edison at the end of the century, leading on to the first light fittings, named after Edison himself. The Edison Screw or ES.
A Tungsten filament is the key element to a Tungsten light source. Light is emitted from the filament when it is heated. The filament is heated by passing current through it. This is possible because of the high amount of current passing through such a small conductor. Inert gas such as Argon usually surrounds the conductor to ensure that it does not ignite. 95% of the energy from a Tungsten light source is wasted in the form of heat. Only 5% of the energy is actually used in the form of visible light. This makes it a very inefficient light source.
Being a blackbody radiator, a Tungsten light source has a continuous spectrum of light. It generates a high amount of red light compared to natural day light, which gives it the yellow tint. Beyond the visible light spectrum a Tungsten light source even emits infrared wavelengths. This is a waste of energy as it cannot be seen by the human eye.

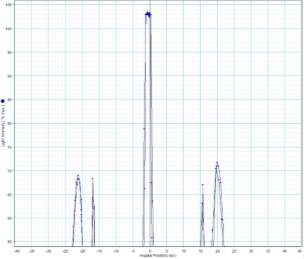
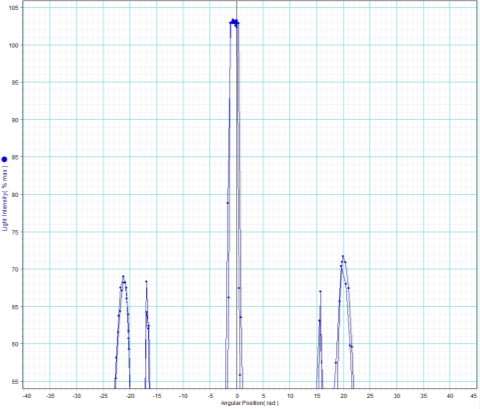
On the next page are the results from the PASCO data acquisition software whilst carrying out the experiment procedure using a Tungsten light source. The light sensor was set to have a gain setting of 100 because of the large spectrum that the wavelength covers.
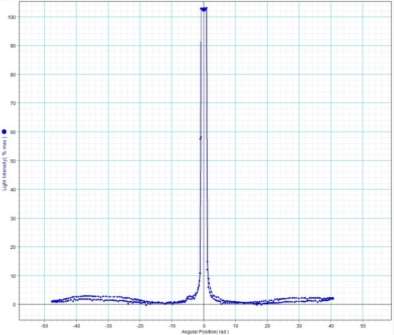
 Peak to peak wavelength:

Infrared Waveform
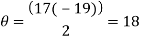
Trough to trough:

Ultraviolet Waveform
My experiment results show that the Tungsten light source is emitting wavelengths in the range of 317.88 to 895.14nm. The Tungsten light source is a warm white light as well as Infrared and Ultraviolet light.

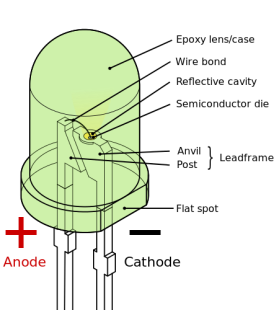 A LED or Light Emitting Diode is a semiconductor that gives out light when current is passed through it. It is a much more efficient method of emitting light compared to more conventional light sources such as Incandescent lights or Fluorescent lights because less heat is generated, resulting in less heat loss.
As well as being more energy efficient compared to Incandescent light sources, LED light sources have a much longer operational time. At the end of an Incandescent lights life the filament will burn out, resulting in the bulb not emitting light. A LED light source after 50,000 hours of use will start to become dimmer and emit less light. The result of this is a light source that lasts a lot longer.
The first commercial LED light sources developed were by Hewlett Packard in 1968 to replace indicator lamps. At this time, only LEDs emitting red light were available. Only later on in 1994 were LEDs that emitted blue light first demonstrated by Isamu Akasaki and Hiroshi Amano, who went on to be awarded the 2014 Nobel Prize in physics for their discovery. With the invention of blue coloured LEDs, the invention of white LEDs became apparent. The white LED is a combination of LEDs that emit red, green and blue light. This then led to the LED light source revolution we currently live within.
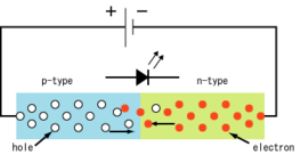
The working principle behind a LED is what is called a ‘P-N Junction’. A P-N junction will convert electric current into visible light. This is often called electroluminescence.

|
Colour |
Wavelength (nm) |
Typical Material Used |
|
Infrared |
> 760 |
Gallium arsenide |
|
Red |
610 to 760 |
Aluminium gallium arsenide |
|
Orange |
590 to 610 |
Gallium arsenide phosphide |
|
Yellow |
570 to 590 |
Gallium arsenide phosphide |
|
Green |
500 to 570 |
Gallium phosphide |
|
Blue |
450 to 500 |
Zinc selenide |
|
Violet |
400 to 450 |
Indium gallium nitride |
|
Ultraviolet |
< 400 |
Indium gallium nitride |
|
White |
Broad Spectrum |
Cool white is a blue LED combined with a yellow phosphor. Warm white is a blue LED combined with a orange phosphor. |
Table 1: Wavelengths of each colour LED
Above is a table outlining the individual wavelengths for each colour that is produced by Light Emitting Diodes.
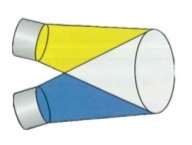
The most common type of LED light source shines line in a single direction. The result of this is a light bulb that only lights up a small area. To correct this problem for use as light sources to light up areas and not as indication lights, most LED light sources are coupled with reflective plates that distribute the light evenly around the room.
On the next page are the results from the PASCO data acquisition software whilst carrying out the experiment procedure using a LED light source. The light sensor was set to have a gain setting of 100 because of the large spectrum that the wavelength covers.


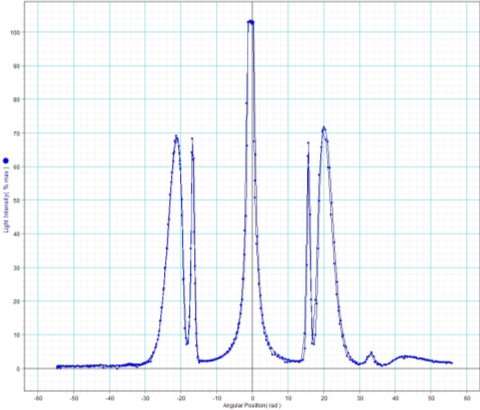
Peak 1
Peak to peak wavelength:

Yellow Waveform
Trough to trough:

Green Waveform
Peak 2
Peak to peak wavelength:

Blue Waveform
Trough to trough:

Blue Waveform
My experiment results show that the LED light source is emitting visible light in the ranges of 388 to 473nm and 514 to 583nm. The LED is emitting a combination of yellow and blue to create a cool white colour.
White LED

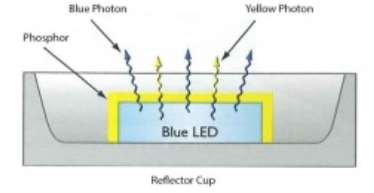
By combining yellow and blue waveforms, a cool white colour is formed. This is carried out by lining a blue LED with yellow phosphor. Both yellow and blue photons are emitted. This method of creating white light is much more effective than the more conventional LED RGB method of combining red, green and blue waveforms. This effect was discovered by Sir Isaac Newton in the early 1700’s when he was performing colour matching experiments.
The colour temperature of the white LED light source is controlled by the thickness of the yellow phosphor that is coated onto the blue LED. Over time, the yellow phosphor will degrade and so the colour characteristics of the LED light source will change. Operating at high temperatures can accelerate this.
Laser Light Source

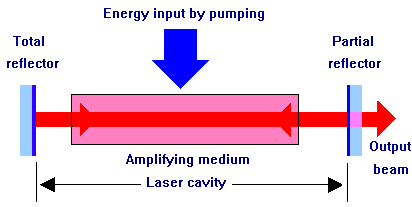
Laser is an acronym of “Light amplification by simulated emission of radiation”. A laser light source emits light when electrons in the atoms of gases become excited by absorbing energy from electrical current. Electrons travel from the lower energy point to the higher energy point around the atoms nucleus. When they travel back from the higher point to their resting state the electrons emit visible light.
The wavelength of the photons emitted are constant and coherent, unlike ordinary visible light from other light sources. This means that only one wavelength of light is emitted from a laser light source, resulting in only one specific colour. Also because of this, the light is not diffused like a conventional light source. The light emitted is a very tight beam. The result of this is a beam of light that can travel much further than other light sources.
By harvesting the narrow powerful light, laser light sources have various applications such as:
- Entertainment – Laser light shows are created by bouncing different lasers into each other to create special effects
- Computing – Lasers can be used as a form of communication due to the high speed of light. The most common application is fibre optics.
- Production – Due to the high amount of energy concentrated in a laser light source, they can be used in production to cut a range of materials.
Optical Fibre Communications

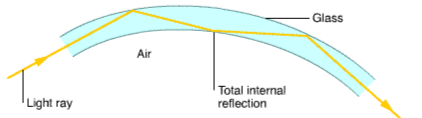 Information in the form of coded light of infrared signals are carry across Optical Fibres. The information carried across Optical Fibres can be much more than an ordinary copper data cable of the same diameter. An optical fibre is a very thin shard of glass. Next to no light is absorbed by the glass. Light is carried from one end to the other by total internal reflection (TIR), even when the fibre is bent. The signals in optical fibres do not weaken as much over long distances as the signals in ordinary cables.
The laser diode that is used for optical fibre communications is typically either 850nm, 1300nm or 1550nm. This means that the waveform used is in the infrared field of the electromagnetic spectrum. We use infrared because the attenuation if the fibre is less at infrared wavelengths.
On the next page are the results from the PASCO data acquisition software whilst carrying out the experiment procedure using a LED light source. The light sensor was set to have a gain setting of 10 because of the small spectrum that the wavelength covers.
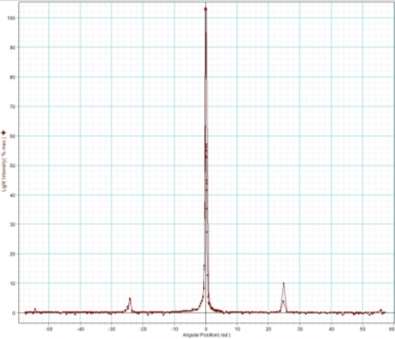

Peak to peak wavelength:

Red Waveform
Trough to trough:

Red Waveform
My experiment results show that the laser light source is emitting visible light in the range of 624 to 690nm. The laser is emitting a red light.
The overall results of the spectrum experiment look unique to each other. All three light sources have different spectra to each other. The Tungsten light source has a wide range across the spectrum covering all the visible colours, as well as ultraviolet light to infrared. The LED light source has a much smaller range across the spectrum compared to the Tungsten light source by only emitting waveforms that combine colours to create a cool white effect. The Laser light source had the smallest range on the visible light spectrum, only covering the colour red. This light source is much more concentrated on one area of the spectrum compared to the other light sources.
From the results, I can see why each type of light source is used for its applications. Tungsten light sources cover all colours within the visible light spectrum, and so they are good for illuminating objects, in the form of a light bulb. LED light sources only cover specific colours within the visible light spectrum, and so they are good for indication lamps and signals. Laser light sources only cover one area of the light spectrum and therefor used for communications.
Laser diode light sources are the key piece of equipment for optical communications because of the small wavelength that they emit. This small wavelength can be interpreted as data signals and used as optical communications.
The overall results of this experiment where great. The result were exactly how I predicted them to be. If I could change anything about the experiment, it would be the Tungsten light source. I would use a larger light source as the Tungsten light source used was not very effective during the experiment.
|
Dr Yongkang Gong |
University of South Wales Lecturer |
For teaching me about light waves |
|
Christopher Edwards Alex Houston Daniel Price |
University of South Wales Students |
For taking part in this series of experiments. |
BBC. (n.d.). Introduction to light waves. Retrieved from BBC Bite Size.
Lighting Research Centre. (n.d.). How is white light made with LEDs? Retrieved from http://www.lrc.rpi.edu/programs/nlpip/lightingAnswers/led/whiteLight.asp
NASA. (n.d.). What Wavelength Goes With a Color? Retrieved from https://science-edu.larc.nasa.gov/EDDOCS/Wavelengths_for_Colors.html
PASCO. (n.d.). Educational Spectrophotometer Accessory Kit and System.
Photon Start. (n.d.). How LEDs Produce White Light. Retrieved from http://www.photonstartechnology.com/learn/how_leds_produce_white_light
Physics Education. (n.d.). What is electromagnetic radiation? Retrieved from http://cmb.physics.wisc.edu/pub/tutorial/spectrum.html
Physics Forums. (n.d.). LED light diffraction . Retrieved from https://www.physicsforums.com/threads/led-light-diffraction-scattering.211563/
Science World. (n.d.). Retrieved from Wolfram: http://scienceworld.wolfram.com/physics/SnellsLaw.html
Snell’s Law Explained. (n.d.). Retrieved from Hyper Physics: http://hyperphysics.phy-astr.gsu.edu/hbase/geoopt/refr.html
The Law of Refraction. (n.d.). Retrieved from Math Fundimentals: https://www.math.ubc.ca/~cass/courses/m309-01a/chu/Fundamentals/snell.htm
TIR. (n.d.). Retrieved from Physics Class Room: http://www.physicsclassroom.com/class/refrn/Lesson-3/Total-Internal-Reflection
X-Rite. (n.d.). What is a spectrophotometer? Retrieved from http://www.xrite.com/learning/other-resources/what-is-a-spectrophotometer
Cite This Work
To export a reference to this article please select a referencing stye below:
Related Services
View all


DMCA / Removal Request
If you are the original writer of this essay and no longer wish to have your work published on UKEssays.com then please click the following link to email our support team:
Request essay removal